The smart way to monitor and manage your data

Smartfolio/Streetsmart Analytics is a web-based back office parking management system that gives you the visibility you need to manage your entire parking operation easily and effectively.
Real-time and historical data for transactions, collections, and maintenance activities.
Track key performance indicators and filter data in graph, map, or list form.
Up to the minute reports on equipment health, and maintenance teams.
Real-time revenue reporting and simple credit card reconciliation.
Manage cash box level warnings, optimise collection routes, and get accurate collection reports.
Easy-to-use, Smartfolio empowers you to build the parking system that works best for you.

Get a high-level view of transaction activities, machines in need of maintenance, and your most recent collection data and more.
Smartfolio / Streetsmart Dashboard
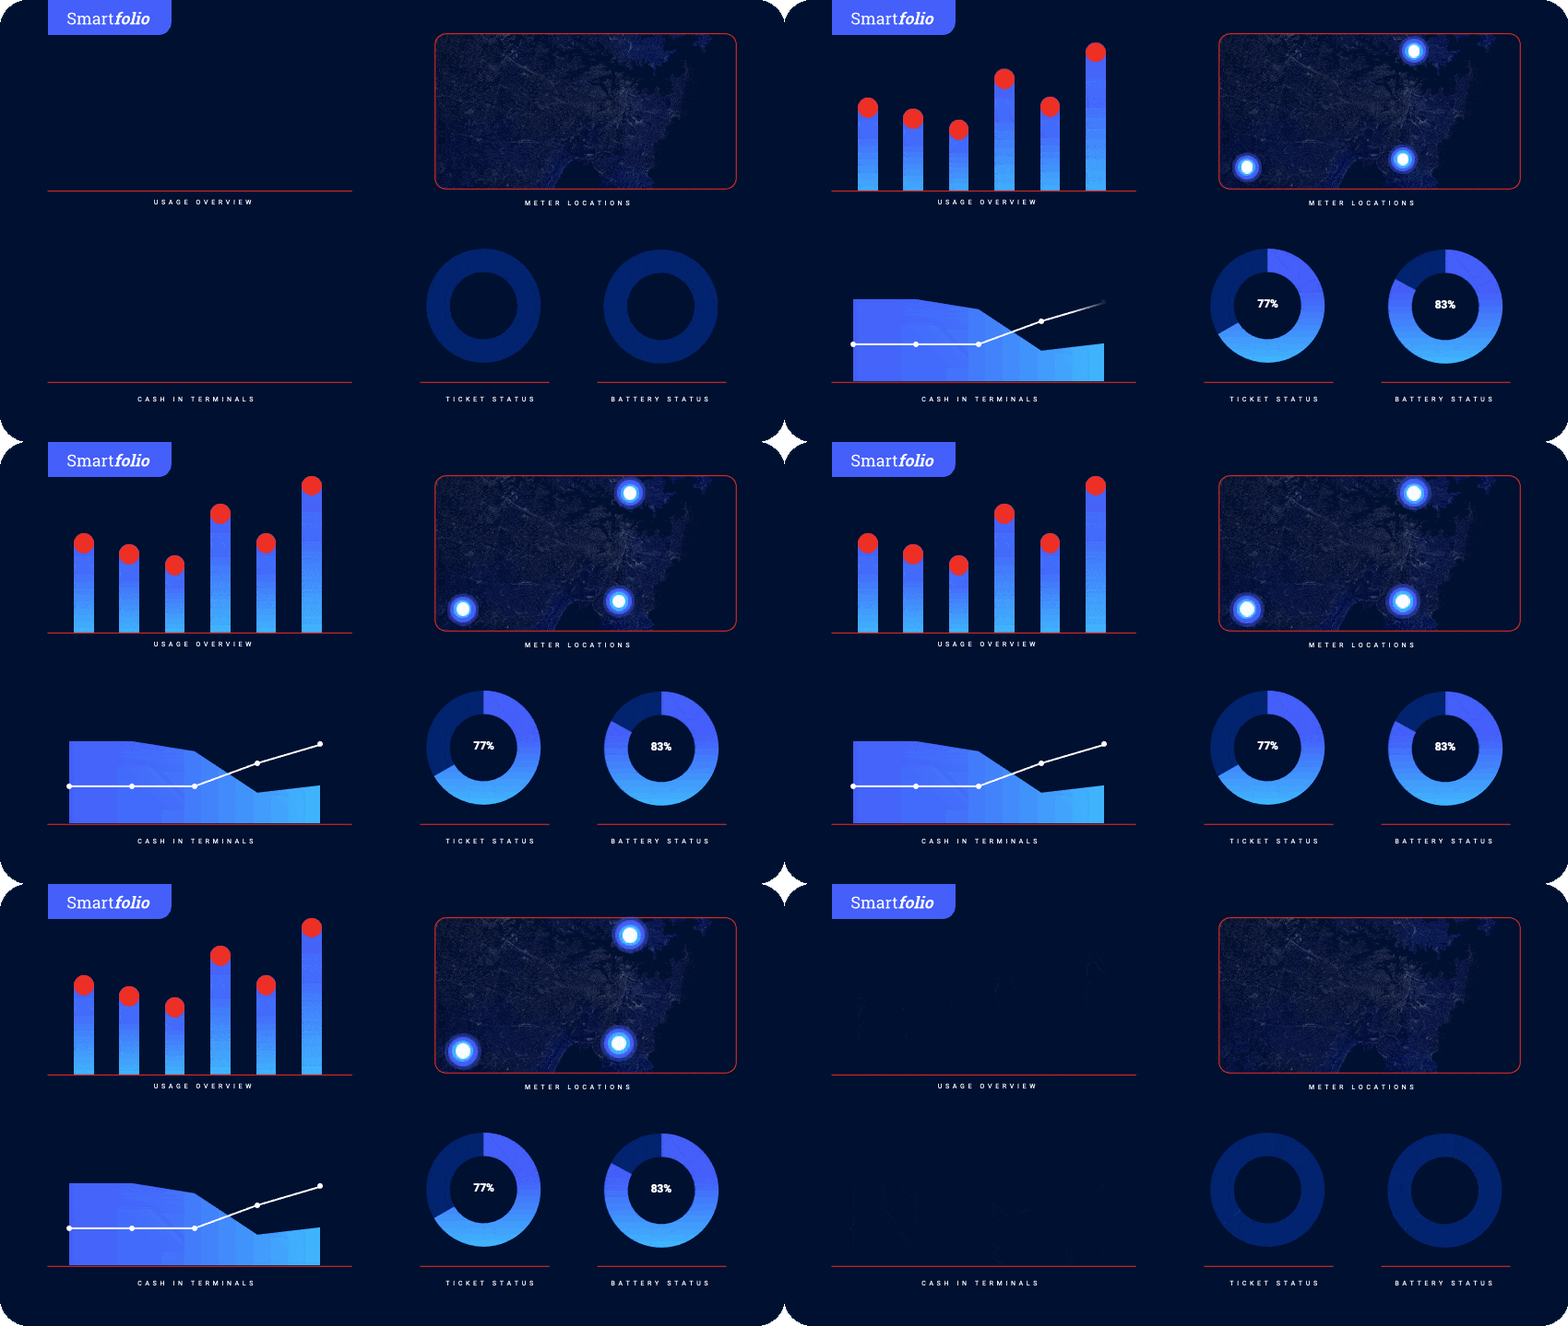
Smartfolio’s dashboard tool enables you to get a quick snapshot of your parking system without wading through lines of data. Our dashboard tool allows you to view the reports that matter to you most. These reports, called Parkjets, appear on your dashboard every time you open Smartfolio so you don’t have to “run” a report or export into another program, they are automatically on your screen.


Smartfolio / Streetsmart Maps
This option provides the ability to display data in a cartographic format for each of the ‘Expert’ workspaces. The information in these cartographic reports are colour and size coded.
Smartfolio / Streetsmart Analyst
Display data aggregated on one dimension on a table & a graphic for each of the ‘Expert’ workspaces. Allows for easy selection of data within a specific date range determined by the user which can be exported and used for various uses such as reconciliation.

Ready to optimise your operations?
Contact us to take control of your parking management.


